
This tutorial starts with a brief descrition of the main GUI window and some of the key operations that can performed. Following that a simple case of how to creat a new XML beam, how to modify an existing XML beam, insert an imaging point and how to create an XML beam from a DICOM-RT file.
Current version of veritas has two main functions. It lets the user enter a) a new control point and b) add imaging points to the XML beam. A flowchart showing two central functions is shown in Figure 1.
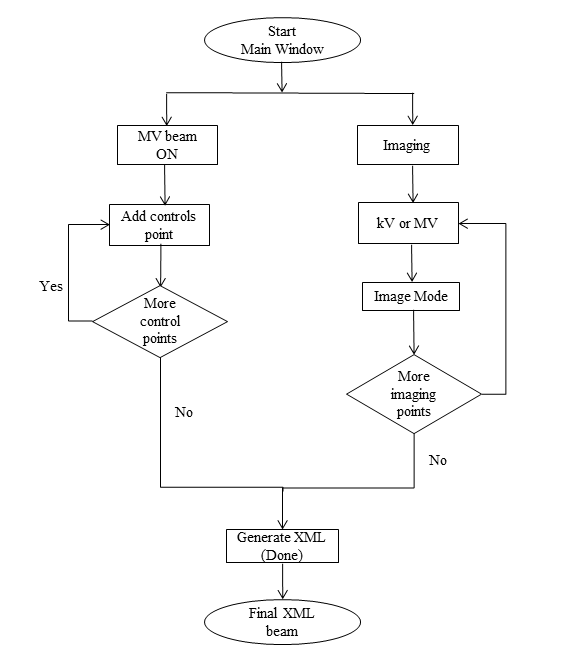
Figure1: Flowchart showing a typical veritas workflow
The main window of the GUI looks as follows:
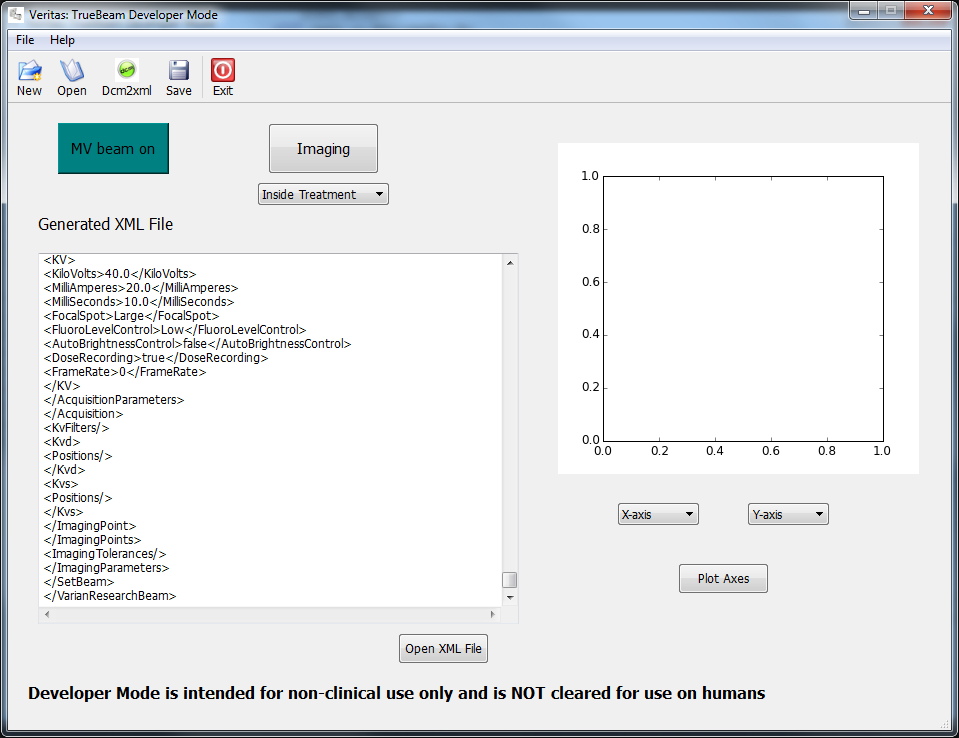
Figure (2) The main window of varian veritas
Some of the key icons and their functions are in the following section.
Push Buttons
Menu Icons
1) The first control point: The first control point some extra info needs to be added.
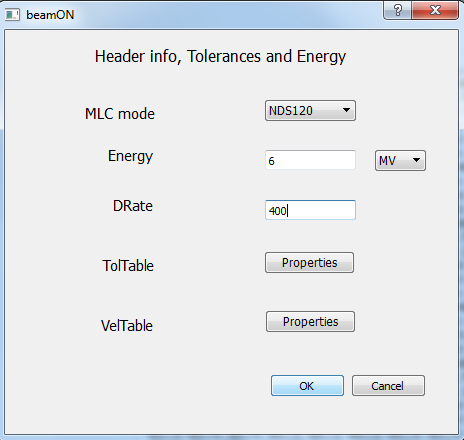
Figure (3) Insert energy, MLC model, dose rate and other informations
2) Control point and various axes: Enter rest of the values for first control point and add other control points
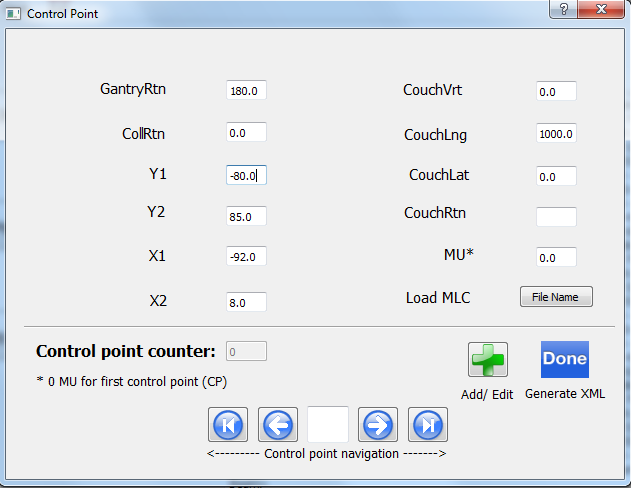
Figure (4) Insert values corresponding to various TrueBeam axes
Note
Control point navigation panel gives a user a set of options for accessing control points. There are currently five opitions avilable to a user.
3) Save the points:
Before moving on to the next ste values for control points please make sure to add/edit values by pressing green add button in Figure 3.
4) Add more control points
Add as many control points as needed.
5) Save and generate XML beam
After having added the control points please press the Generate XML button and a final XML beam will be genrated. The Generated XML window in Figure 1 shows that user gets a first glimpse of the file.
Note
The file can also accessed via Open XML file option as show in the figure 1.
For sanity check user can plot the generated XML file
During treatment images
In treatment imaging captures images concurrent with the MV therapeutic beam. Logically, imaging points are specified as MU vs. position trajectory. A user is presented with a screen with an option to choose from kV or MV image as shown in Figure 5
1) Fill in kV or MV parameters
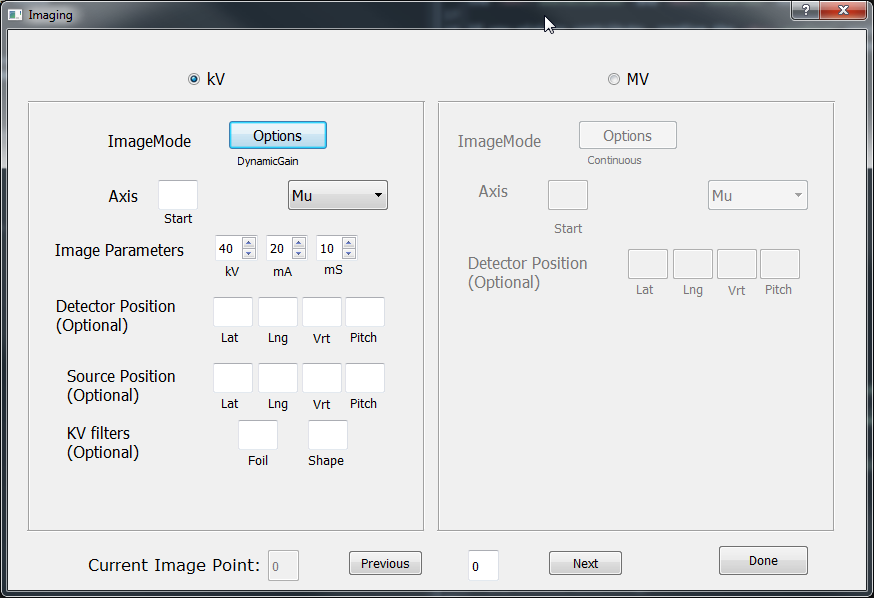
Figure (5) Main imaging window with the option of insert kV as well MV images
User can add imaging points and proceed to next point.
2) Choose image modes
Current version gives user 4 kV and 6 MV image mode options. These are shown in figures 6 and 7.
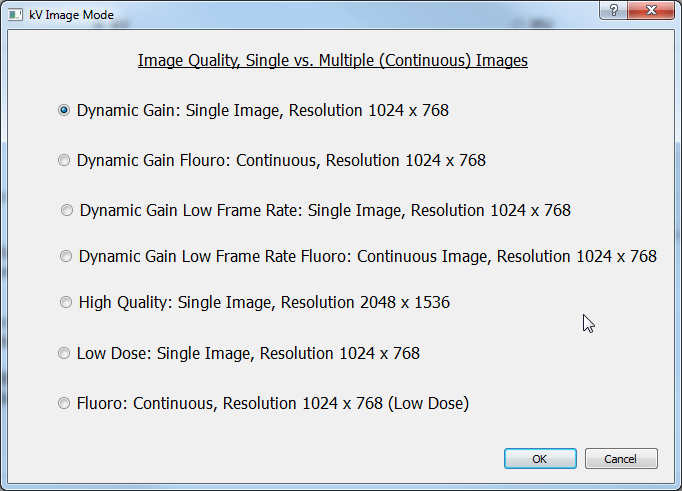
Figure (6) Image modes avilable for kV imaging

Figure (7) Image modes avilable for MV imaging
3) Finish entering imaging points
After having add all the imaging points user can press the done button.
Currently, MU vs Gantry Rotation function can be plotted for a given XML beam. A typical XML plot is shown in Figure (8)
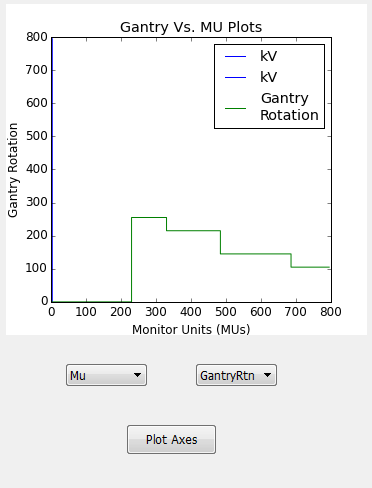
Figure (8) An example of MU vs Gantry rotation plot
A typical XML file generated by Veritas can be accessed through a text editor (shown in Notepad++). The text editor functionality gives the user flexibility to control the generated XML file by hand.
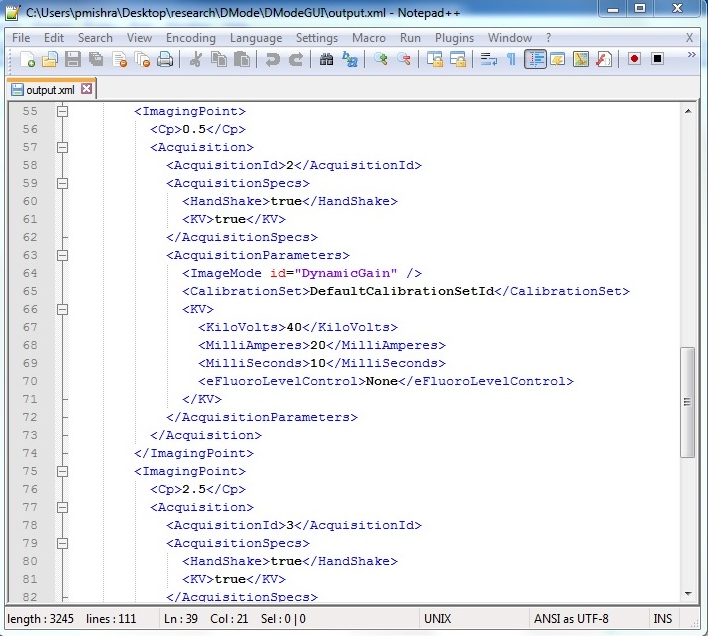
Figure (9) An XML file shown in a text editor (shown in Notepad++)
The main window of the GUI looks as follows:
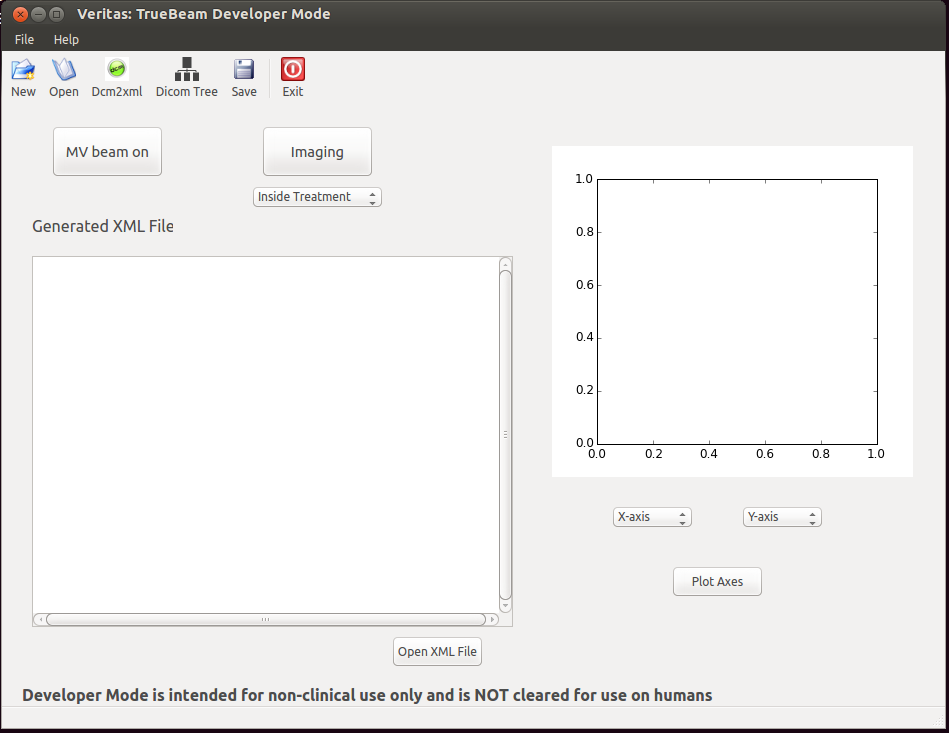
Figure (10) The main window of varian veritas
In main waindow, There is button for Dicom Tree.
On click of Dicom Tree button, user can upload dicom file to list out the attributes of dicom file.

Figure (11) Dicom file attributes shown in a tree structure